mdciao: Analysis of Molecular Dynamics Simulations Using Residue Neighborhoods
![]()
![]()
![]()
![]()
![]()

mdciao is a Python module that provides quick, “one-shot” command-line tools to analyze molecular simulation data using residue-residue distances. mdciao tries to automate as much as possible for non-experienced users while remaining highly customizable for advanced users, by exposing an API to construct your own analysis workflow.
Under the hood, the module mdtraj is doing most of the computation and handling of molecular information, using BioPython for sequence alignment, pandas for many table and IO related operations, and matplotlib for visualizaton. It tries to automatically use the consensus nomenclature for
GPCRs, e.g. Ballesteros-Weinstein-Numbering or structure-based schemes by Gloriam et al,
G-proteins, via Common G-alpha Numbering (CGN), and
Kinases, via their 85 pocket-residue numbering scheme.
by either using local files or on-the-fly lookups of the GPCRdb and/or https://www.mrc-lmb.cam.ac.uk/CGN/ and/or KLIFS, respectively.
Basic Principle
mdciao takes the files typically generated by a molecular dynamics (MD) simulation, i.e.
topology files, like prot.gro or prot.pdb
trajectory files, like traj1.xtc, traj2.xtc
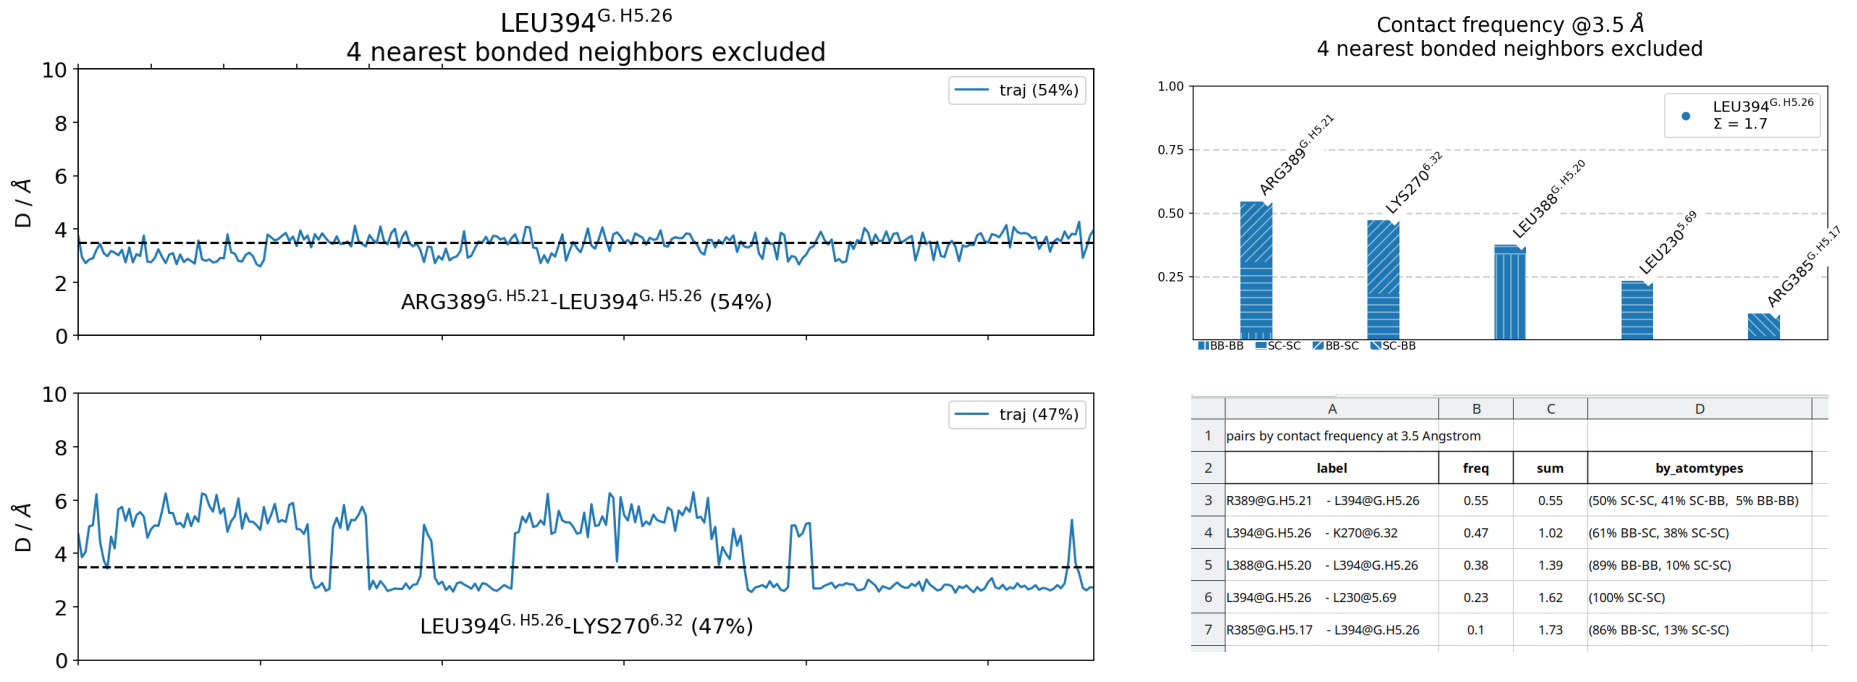
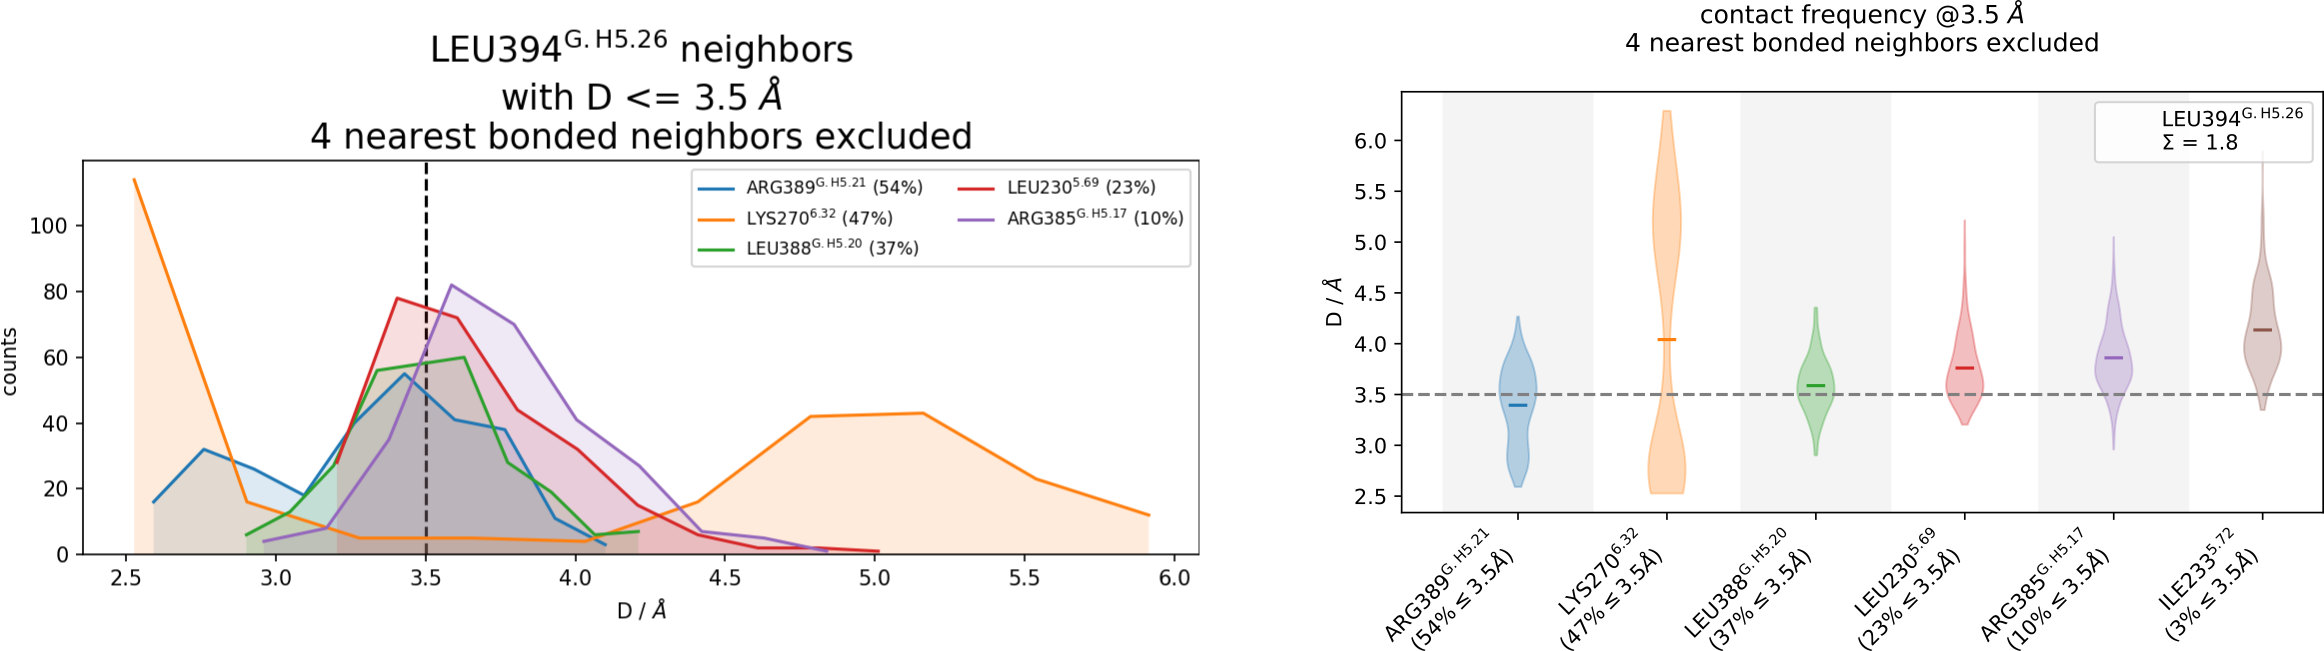
and calculates the time-traces of residue-residue distances, and from there, contact frequencies and distance distributions.
Note
A note of caution regarding the above definitions for contact and frequency:
the kinetic information is averaged out. Contacts quickly breaking and forming and contacts that break (or form) only once will have the same frequency as long as the fraction of total time they are formed is the same. For analysis taking kinetics into account, use. e.g. pyemma.
The sharp, “distance-only” cutoff can sometimes over- or under-represent some interaction types. Modules like get_contacts capture these interactions better, and have a ton of other features features.
Frequencies are just averages over the input data. In some cases, simply computing averages is a bad idea. The user is responsible for deciding over what data to average. For example, if your data is highly heterogenous you might want to cluster your data into into
cluster1.xtc,cluster.2.xtcetc and then do a per-cluster analysis withmdciao
These issues (if/when they arise) can be spotted easily by looking at the time-traces and informed decisions can be made wrt to parameters like the cutt-off value, number of contacts displayed and many others.